Supporting materials
Download
Download this article as a PDF

Fresh water is a scarce resource on our planet – but how many of us are aware of how much water is needed to make the foods we eat every day?
You are probably aware that the choices we make as consumers affect how much carbon dioxide is produced on our behalf – and thus how we can try to decrease our ‘carbon footprint’. But have you ever thought about how much water is consumed in making the items we use daily? Fresh water is a limited resource on our planet – in fact, a shortage of fresh water is one of the most urgent global problems. So it’s important that we all become more aware of our ‘water footprint’, which measures the amount of water used to produce each of the goods and services we use.

Although people are becoming aware of the large volumes of water needed to produce some of the items we wear (such as jeans or cotton T-shirts), there is perhaps less awareness of the huge contribution that food makes to our personal water footprint. In fact, it’s by far the most important single factor: almost 80% of an individual’s water footprint is linked to the food they eat. As a science teacher, I was inspired by this amazing fact to raise awareness among my students of the amount of water used in producing foods – and of the need to conserve water in our food choices and, of course, to avoid food waste wherever possible.
The activities described in this article allow students to explore the wide variation in water footprints associated with different foods, and then to apply this knowledge to finding out the water footprint of various ready-made ‘lunch boxes’. Structured discussions after the activities can further encourage students to apply what they have learned in class to their own real-life dietary choices at school and at home. The calculations involved in evaluating the lunch boxes also require some careful arithmetic.
In this activity, students guess the water footprint of some common foods, before finding out the answers from their teacher. This can be done with or without internet research, as the answers are provided within the activity. Students can work individually or in groups, remotely or in class.
| Item | Amount | Water footprint? |
|---|---|---|
| Chocolate | 1 bar (100 g) | |
| Bread | 100 g | |
| Pasta (uncooked) | 100 g | |
| Chicken (cooked) | 100 g | |
| Beef (cooked) | 100 g | |
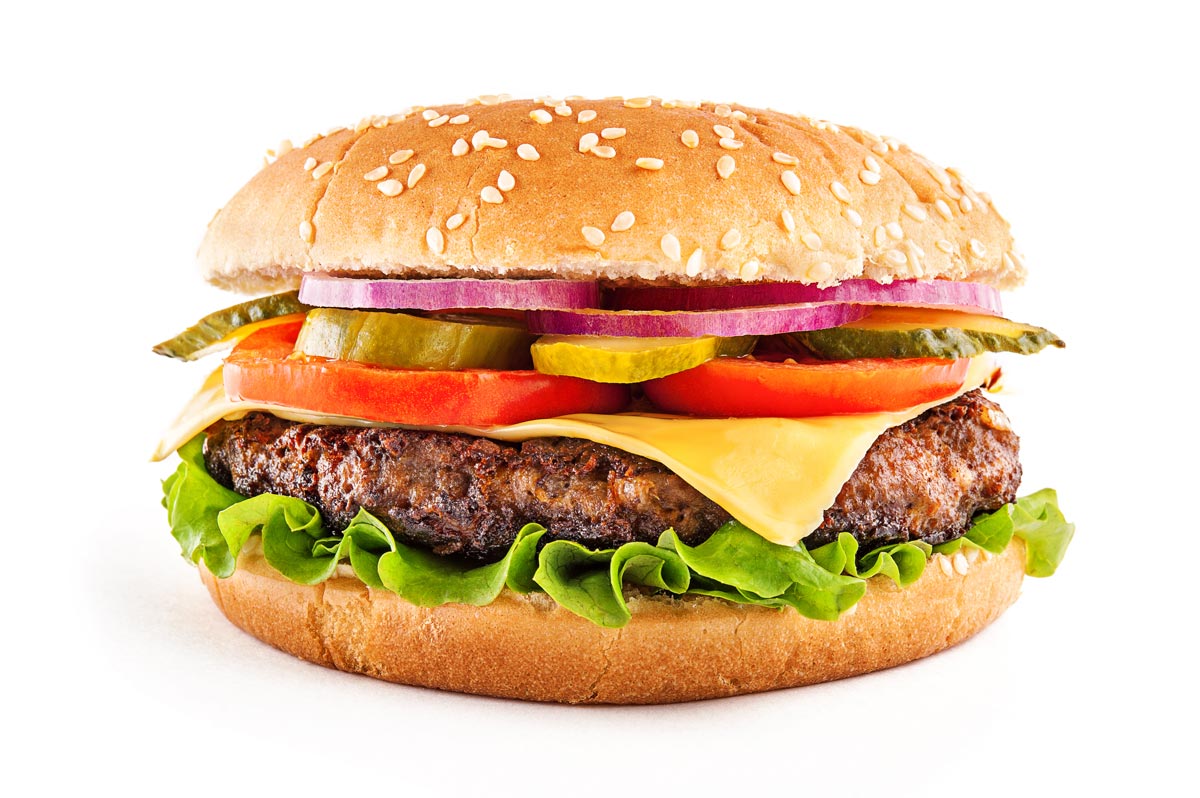
| Hamburger | 120 g patty with bun and garnish | |
| Apple | 1 average (150 g) | |
| Milk | 1 glass (300 ml) | |
| Beer | 1 large glass (500 ml) | |
| Tea (without milk or sugar) | 1 large cup (250 ml) | |
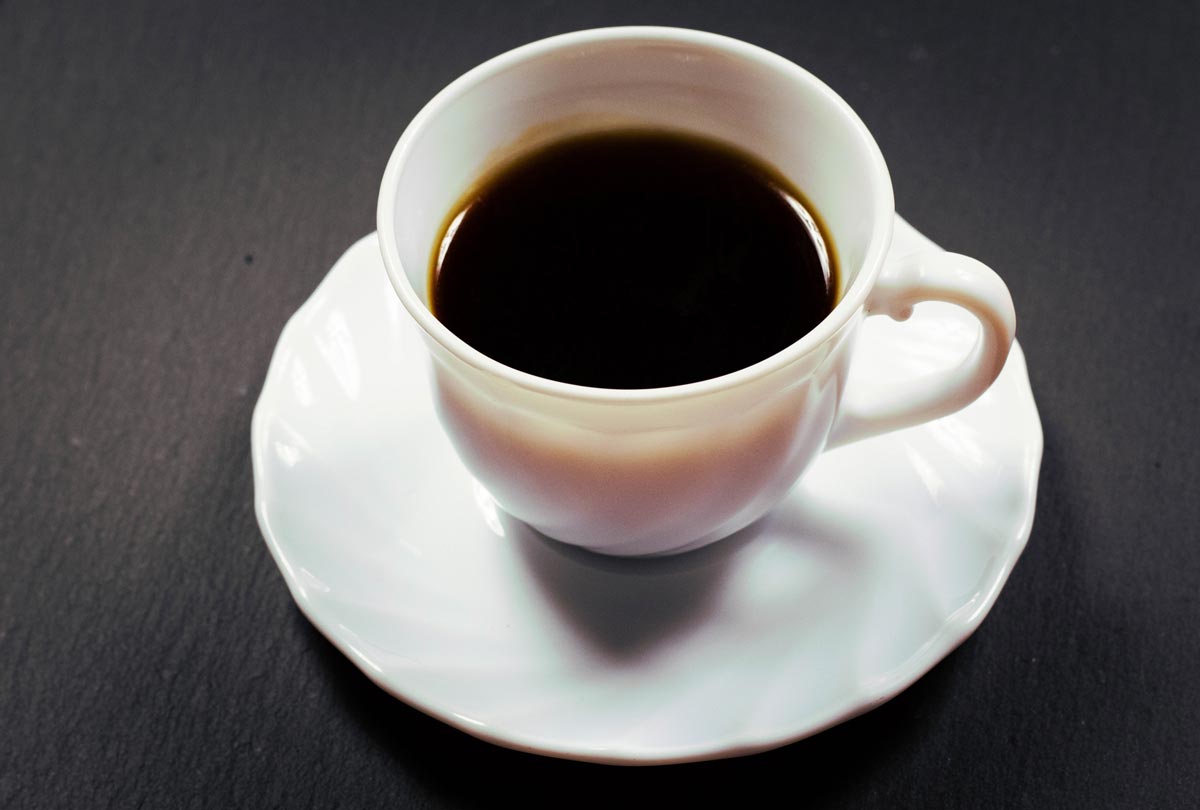
| Coffee (without milk or sugar) | 1 small cup (125 ml) |
1. Ask the students to read the descriptions of each item and guess what the water footprint could be – that is, how much water is needed to produce the item. Students should choose from the following categories, entering the chosen letter in the third column of table 1:
A: 1–50 litres
B: 50–100 litres
C: 100–200 litres
D: 200–500 litres
E: 500–1000 litres
F: 1000–2000 litres
G: over 2000 litres
2. Once students have submitted their guesses, provide feedback via the answers in table 2.
| Item | Amount | Water footprint (litres) |
|---|---|---|
| Chocolate | 1 bar (100 g) | F (1700) |
| Bread | 100 g | C (130) |
| Pasta (uncooked) | 100 g | C (141) |
| Chicken (cooked) | 100 g | D (433) |
| Beef (cooked) | 100 g | F (1540) |
| Hamburger | 120 g patty with bun and garnish | G (2400) |
| Apple | 1 average (150 g) | C (123) |
| Milk | 1 glass (300 ml) | D (306) |
| Beer | 1 large glass (500 ml) | C (148) |
| Tea (without milk or sugar) | 1 large cup (250 ml) | A (30) |
| Coffee (without milk or sugar) | 1 small cup (125 ml) | C (130) |
It’s important to emphasise that these figures are approximate and can vary greatly for different foods of the same type, depending on how that food and the ingredients it contains are produced.
Water footprints tell us how much of Earth’s limited water supplies we are using, so we can ask: how could each of us save water by making small changes to the items we consume?
Suggested follow-up questions to ask after this activity include:
Students can use the internet to investigate these questions. Useful websites to use for water footprint values, and also for explanations regarding why these vary, are shown in the resources section at the end of this article.


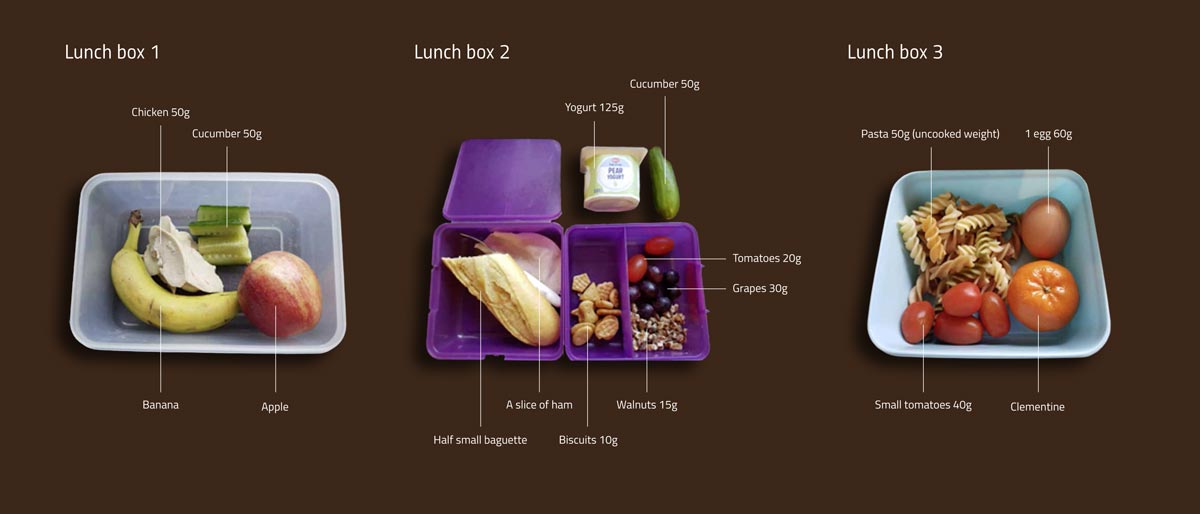
In this activity, students use their own research to work out the approximate water footprints of six ready-made lunch boxes. They can use this information to think about – and maybe change – what they choose to put in their own packed lunches. Again, students can work individually or in groups, remotely or in class.
A teacher resource with values for each item and calculations for each lunch box is provided, but please note that these values are not precise: they are based on approximate weights, and items grown in different countries will use different amounts of water depending on the raw materials needed to grow and harvest the item. There is thus wide variation in values for the same foodstuff between different sources.

Suggested follow-up questions for after this activity include:
The last question could be used as the basis for a student competition, with students voting for the best lunch box: the most tempting items combined with a low water footprint.
Fresh water is a limited resource that is unevenly distributed on Earth and put at further risk by climate change and the growing world population. This article provides teachers and students with an excellent opportunity to address a critical global issue by means of simple but stimulating activities.
Starting from everyday experiences of eating and drinking, the author engages students with a quiz about the water footprint of common foods and beverages, leading them to understand the hidden resource consumption needed to bring these products to our table. Students are then presented with several different lunch boxes and challenged to find a tasty and sustainable selection of food for their own meal.
I recommend this activity to secondary school teachers interested in addressing sustainability issues in a friendly and engaging way, which is aimed at promoting responsible choices and behaviours among their students. In addition, the activities can be easily carried out at school or remotely, as only a computer and internet access are required.
Giulia Realdon, natural sciences teacher and education researcher, Italy.
Download this article as a PDF